
RC low-pass filter lab: cutoff frequency and AC sweep
- Objective
- Find the cutoff frequency of an RC low-pass filter, fc = 1/(2πRC), and check it with the lab's AC sweep (frequency response): read the output's magnitude and phase from 1 Hz to 10 kHz, find where the output is 0.707 of the input and lags by 45°, and see the output fall about ten times per decade above the cutoff.
- Level
- High school physics and first-year college
- Time
- 45 minutes
- Topics
- RC filters, low-pass filters, cutoff frequency fc = 1/(2πRC), frequency response, gain and phase, decibels, capacitive reactance
Steps
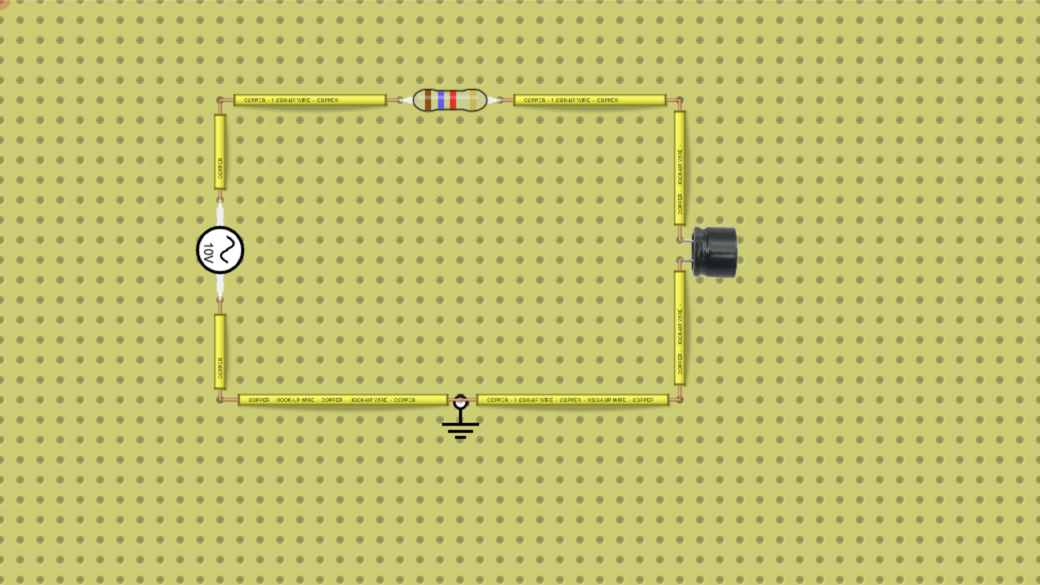
- Look at the circuit: a sine AC source on the left (10 V peak, 100 Hz), a 1.6 kΩ resistor (brown-blue-red-gold) along the top, a 1 µF capacitor on the right and a ground at the bottom. The input is the source's top terminal and the output is the top of the capacitor. Before you start, work out fc = 1 ÷ (2π × R × C).
- The charts are only in the full lab: press Open in the lab and sign in. Press the NGSpice button. The chart window opens with Analysis Type set to Time Domain. Tick N1 (the input) and N2 (the output) under Volts.
- On the Time Domain chart, read the peak of the input and the peak of the output, and the time between an input peak and the next output peak (the chart has a point every 0.5 ms). Read them on a later cycle, not the first one: the start of the chart is still settling. Write the three readings down for question 4.
- Set Analysis Type to AC Sweep. The chart now shows the output against frequency, from 1 Hz to 10 kHz with 100 points per decade: its magnitude in volts and its phase in degrees. Tick N2 under V(f) if it is not ticked.
- Move the pointer along the curves and record the magnitude and the phase of N2 at 1 Hz, 10 Hz, 50 Hz, 100 Hz, 200 Hz, 1 kHz, 2 kHz and 10 kHz. The sweep has no point at exactly 50 Hz, so take the point nearest each frequency.
- Find the frequency where the magnitude is 7.07 V (0.707 of the 10 V input) and the phase is −45°; no point falls exactly on it, so take the nearest one. That is the cutoff frequency: compare it with your fc.
- For each row, work out the gain Vout ÷ Vin and, if your teacher asks for it, the gain in decibels, 20 × log10(Vout ÷ Vin). The lab's chart has no dB axis, so this column is your own work.
Data table
| Frequency (Hz) | Output magnitude N2 (V) | Phase N2 (°) | Gain Vout ÷ Vin | Gain (dB), worked out | Computed 1/√(1 + (f/fc)²) |
|---|---|---|---|---|---|
Questions
- Work out fc for 1.6 kΩ and 1 µF. At what frequency did the AC sweep show 7.07 V and −45°, and does it agree?
- Use |H| = 1/√(1 + (f/fc)²) and phase = −arctan(f/fc) to work out the output at 10 Hz, 1 kHz and 10 kHz, and compare them with your readings.
- Convert your readings at 100 Hz, 1 kHz and 10 kHz to decibels. By how many decibels does the output fall for every tenfold rise in frequency above the cutoff? And between 1 kHz and 2 kHz?
- On the Time Domain chart at 100 Hz, why is the output peak smaller than 10 V, and why does it come later than the input peak? Work out the delay from the −45° phase.
- Explain in terms of the capacitor's reactance, Xc = 1/(2πfC), why the filter passes low frequencies and blocks high ones.
- Predict, without measuring: what capacitor would move the cutoff to about 1 kHz with the same resistor? What would the cutoff be with a 3.2 kΩ resistor and the 1 µF capacitor?
For teachers
Answer key
- Computed: fc = 1 ÷ (2π × 1600 Ω × 0.000001 F) = 99.5 Hz. Measured on the AC sweep: 7.05 V and −45.2° at 100 Hz, the point nearest the cutoff, so the chart agrees. At the cutoff the output is 1/√2 = 0.707 of the input (7.07 V of 10 V) and lags it by 45°, because there the capacitor's reactance equals the resistance.
- Computed: at 10 Hz, 9.95 V and −5.7°; at 1 kHz, 0.990 V and −84.3°; at 10 kHz, 0.0995 V and −89.4°. Measured on the AC sweep: the same values, 9.95 V −5.7°, 0.990 V −84.3° and 0.0995 V −89.4°, and also 10.00 V −0.6° at 1 Hz, 8.93 V −26.7° at 50.1 Hz, 4.46 V −63.5° at 200 Hz and 0.498 V −87.2° at 2 kHz. Every reading equals the formula to three digits.
- Worked out from the readings: 20 × log10(7.05 ÷ 10) = −3.0 dB at 100 Hz, 20 × log10(0.990 ÷ 10) = −20.1 dB at 1 kHz and 20 × log10(0.0995 ÷ 10) = −40.0 dB at 10 kHz. Well above the cutoff the output falls by 20 dB, ten times, for every tenfold rise in frequency: from 1 kHz to 10 kHz it goes from −20.1 dB to −40.0 dB (−20 dB per decade). The first decade, from the cutoff to 1 kHz, falls only about 17 dB (−3.0 to −20.1 dB), because the slope bends in around the cutoff. From 1 kHz to 2 kHz it halves (0.990 V to 0.498 V), about −6 dB per doubling. The cutoff is also called the −3 dB point.
- At 100 Hz the capacitor's reactance (1.6 kΩ) is about equal to the resistor, so the source's voltage is shared between them and the output is about 0.7 of the input: about 7.0 V peak on the chart against 10 V. The capacitor's voltage can only change as current charges it, so it lags: −45° of a 10 ms period is 10 ms × 45 ÷ 360 = 1.25 ms (computed). On the chart, which has a point every 0.5 ms, the output peak comes 1 to 1.5 ms after the input peak.
- Xc = 1/(2πfC) falls as the frequency rises. At low frequency Xc is much bigger than 1.6 kΩ (16 kΩ at 10 Hz, computed), so almost all the voltage stays across the capacitor and reaches the output. At high frequency Xc is much smaller (16 Ω at 10 kHz, computed), the capacitor almost shorts the output to ground, and nearly all the voltage is lost across the resistor. That is why it is called a low-pass filter.
- Computed: C = 1 ÷ (2π × 1600 Ω × 1000 Hz) = 99.5 nF, so a 100 nF capacitor gives about 995 Hz. With 3.2 kΩ and 1 µF, fc = 1 ÷ (2π × 3200 Ω × 0.000001 F) = 49.7 Hz: doubling R or C halves the cutoff. You can try both in the full lab: click the resistor or the capacitor to change its value, then run the AC sweep again.
Frequently asked questions
Do students need an account?
Not to run the circuit on this page: it runs in the browser without signing in. To work in the full lab (Open in the lab), students sign in, and free accounts have a time limit there. Saving their own copy needs a DCACLab plan. To hand the work in as an assignment, they join your class through its join link.
Who can run the AC Sweep?
The NGSpice charts are only in the full lab (Open in the lab), not in the copy of the circuit on this page. Any signed-in account can run AC Sweep, Time Domain and DC Sweep, free accounts included (within the free account's time limit), except accounts on the Starter plan, which cannot open these charts.
Does the lab draw the response in decibels?
No. The AC Sweep chart shows the output's magnitude in volts on a linear axis and its phase in degrees against frequency, from 1 Hz to 10 kHz with 100 points per decade (the range is fixed). Students convert the readings to decibels themselves with 20 × log10(Vout ÷ Vin), which is a good exercise in its own right.
Want to change the circuit or start your own? Open the circuit simulator
Quick challenges to warm up: Electric circuit games
More in the virtual lab: Virtual physics lab for circuits and electronics
Teaching with circuits?
Create a classroom, give your students this lab, and review what they submit. The free classroom demo gives you one classroom with room for 30 students for 7 days, counted from when your first student joins (once per teacher); after that it keeps up to 5 students.
Try the free classroom demo