
RC circuit lab: charging, discharging and the time constant
- Objective
- Charge a capacitor through a resistor, read the time constant τ = RC off the NGSpice Time Domain chart as the time to reach 63 % of the battery voltage, compare the curve with Vc = Vs(1 − e^(−t/RC)), and watch the capacitor discharge on the V meter.
- Level
- High school physics and first-year college
- Time
- 40 minutes
- Topics
- Capacitors, RC circuits, the time constant τ = RC, exponential charging and discharging, charging current, 63 % and 37 %, the 5τ rule
Steps
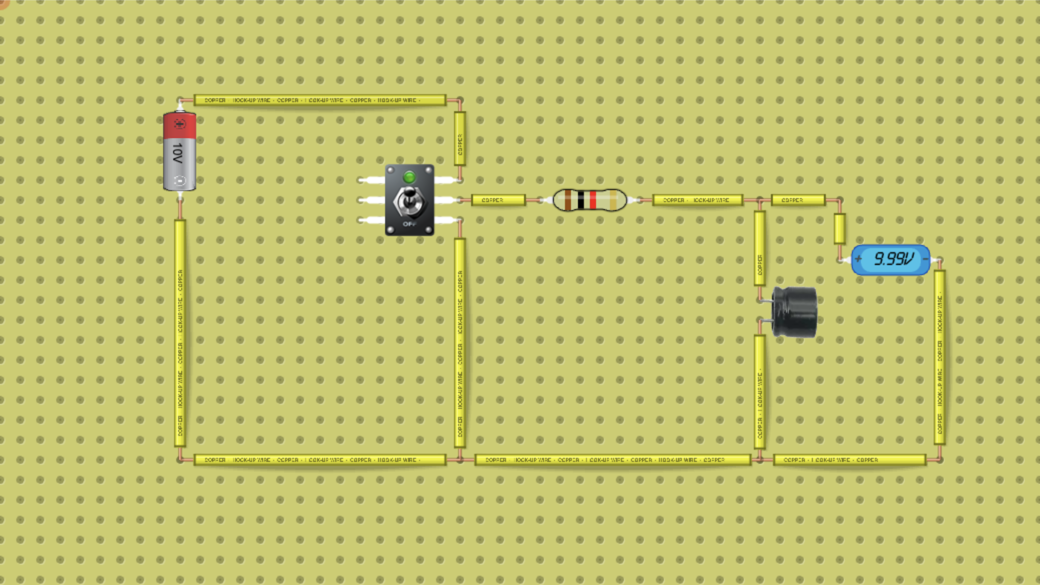
- Look at the circuit: a 10 V battery on the left, a two-way toggle switch, a 1 kΩ resistor (brown-black-red-gold), a 1000 µF capacitor and a V meter (voltmeter) across the capacitor. The switch's middle terminal goes to the resistor; in its ON position it connects the resistor to the battery's + (charging), in its OFF position to the battery's − (discharging). It is ON when the circuit loads. Before you start, work out τ = R × C.
- Run the circuit on this page; it runs without signing in. Watch the V meter: it climbs fast at first, then more and more slowly, and settles at 9.99 V after about 5 seconds. This copy of the lab has no chart, so for the next steps press Open in the lab and sign in.
- In the full lab, press the NGSpice button. The chart window opens with Analysis Type set to Time Domain, and this circuit's window is set to 5 s (five time constants). Tick N4 under Volts (the top of the capacitor) and C1 under Amps (the capacitor's current).
- Read the charging curve on the N4 chart: record the capacitor voltage at 1, 2, 3, 4 and 5 s in the table, and the percentage of 10 V each one is. Then find the time at which the curve reaches 6.32 V, 63.2 % of 10 V: that time is τ.
- Read the C1 chart at the start and at 1 s and record the current. The chart shows it negative; the sign is only the direction in which the lab counts the capacitor's current.
- Discharge. The chart cannot show it: when you flip the switch with NGSpice on, the chart starts again from an empty capacitor. Close the chart window with its × button (this turns NGSpice off) and wait until the V meter reads 9.99 V again.
- Click the switch to set it to OFF and start a stopwatch at the same moment (or film the screen with a phone). Record the V meter at about 1 s, 2 s and 5 s in the last column. Compare each reading with 37 % of 9.99 V.
Data table
| Time (s) | Charging: N4 on the chart (V) | Percent of 10 V | Computed: 10 V × (1 − e^(−t/RC)) (V) | C1 current on the chart (mA) | Discharging: V meter (V) |
|---|---|---|---|---|---|
Questions
- Work out τ = R × C for 1 kΩ and 1000 µF. At what time did the chart reach 6.32 V, and does it agree?
- Use Vc = 10 V × (1 − e^(−t/RC)) to work out the capacitor voltage at 2, 3, 4 and 5 s and compare it with your chart readings. Why do engineers say a capacitor is full after about 5τ, when the formula never quite reaches 10 V?
- Why is the current largest the moment charging starts? Work out its value at t = 0 and at t = 1 s with I = (Vs ÷ R) × e^(−t/RC), and compare with the C1 chart.
- During discharge, what did the V meter read at about 1 s, 2 s and 5 s? What fraction of the starting voltage is left after one time constant?
- The V meter settles at 9.99 V, not 10 V. The lab's V meter has a resistance of 1 MΩ. Use the voltage divider rule to explain the reading.
- Predict, without measuring: what would τ be with a 2.2 kΩ resistor and the same capacitor? With 1 kΩ and a 470 µF capacitor? How long would each take to be practically full?
For teachers
Answer key
- Computed: τ = 1000 Ω × 0.001 F = 1 s. Measured: the N4 chart reached 6.32 V (63.2 % of 10 V) at about 0.99 s and read 6.37 V at 1.00 s, so the time constant read off the chart is 1 s, as computed. Near the start, the chart's points sit about 10 ms ahead of their time labels (measured: it reaches 6.32 V at 0.99 s, and reads 4.02 V at 0.50 s, the computed value for about 0.51 s), so readings in the steep first second come out a little high. 63.2 % is 1 − e^(−1): after one time constant the capacitor has covered that share of the way to the battery voltage.
- Computed: 8.65 V at 2 s, 9.50 V at 3 s, 9.82 V at 4 s and 9.93 V at 5 s. Measured on the chart: 8.66 V, 9.50 V, 9.81 V and 9.92 V, within 0.01 V. Each time constant closes 63 % of the gap that is left, so the gap shrinks to 37 %, 13.5 %, 5 %, 1.8 % and 0.7 % of 10 V. The formula never reaches 10 V exactly, but after 5τ the capacitor is within 1 %, closer than most meters can tell, so 5τ is taken as full.
- At t = 0 the capacitor is empty, so it has no voltage to push back against the battery, and all 10 V is across the resistor: I = 10 V ÷ 1 kΩ = 10 mA (computed). As the capacitor charges, the voltage left across the resistor falls, and so does the current: at 1 s, 10 mA × e^(−1) = 3.68 mA (computed). Measured on the C1 chart: −10.0 mA at the start and −3.62 mA at 1 s; the minus sign is only the lab's direction for the capacitor's current. The 3.62 mA at 1 s, against 3.68 mA computed, is the same 10 ms shift of the chart's points.
- Measured on the V meter (read every 0.5 s): 9.99 V at the start, 3.52 V at about 1.0 s, 1.29 V at 2.0 s and 0.06 V at 5 s. Computed with Vc = 9.99 V × e^(−t/RC): 3.68 V at 1 s, 1.35 V at 2 s and 0.07 V at 5 s. After one time constant about 37 % (e^(−1)) is left. The readings are a little lower than computed because each one was taken a moment after its mark; with a stopwatch, a tenth of a second either way is normal, which gives roughly 3.3 V to 4.1 V at 1 s (computed). Discharge is the same exponential as charging, turned upside down.
- The V meter and the resistor form a voltage divider once the capacitor is full and no more current flows into it: 10 V × 1 MΩ ÷ (1 MΩ + 1 kΩ) = 9.99 V (computed), the reading you see. The meter draws 10 V ÷ 1.001 MΩ ≈ 10 µA, a thousand times less than the starting current, so it barely changes the time constant.
- Computed: 2.2 kΩ × 1000 µF gives τ = 2.2 s, practically full after 5τ = 11 s; 1 kΩ × 470 µF gives τ = 0.47 s, full after about 2.35 s. A bigger resistor lets less current through, and a bigger capacitor needs more charge for each volt, so either one makes the charging slower. You can try them in the full lab: click the resistor or the capacitor to change its value.
Frequently asked questions
Do students need an account?
Not to run the circuit on this page: it runs in the browser without signing in. To work in the full lab (Open in the lab), students sign in, and free accounts have a time limit there. Saving their own copy needs a DCACLab plan. To hand the work in as an assignment, they join your class through its join link.
Who can use the NGSpice Time Domain chart?
The chart is only in the full lab (Open in the lab), not in the copy of the circuit on this page. Any signed-in account can run Time Domain, AC Sweep and DC Sweep, free accounts included (within the free account's time limit), except accounts on the Starter plan, which cannot open these charts.
Why do students watch the discharge on the V meter instead of the chart?
When the switch is flipped with NGSpice on, the Time Domain chart starts a new run from an empty capacitor, so it would show no discharge at all. With NGSpice off, the lab's normal simulation keeps the capacitor's charge, and the V meter shows it falling: about 37 % is left after 1 s, one time constant.
Want to change the circuit or start your own? Open the circuit simulator
Quick challenges to warm up: Electric circuit games
More in the virtual lab: Virtual physics lab for circuits and electronics
Teaching with circuits?
Create a classroom, give your students this lab, and review what they submit. The free classroom demo gives you one classroom with room for 30 students for 7 days, counted from when your first student joins (once per teacher); after that it keeps up to 5 students.
Try the free classroom demo